Good citizens pay their taxes to the federal government. Other citizens in greater need receive distributions from central treasuries. Taxes are also spent on more generic services like highways, military, and science research benefiting us all.
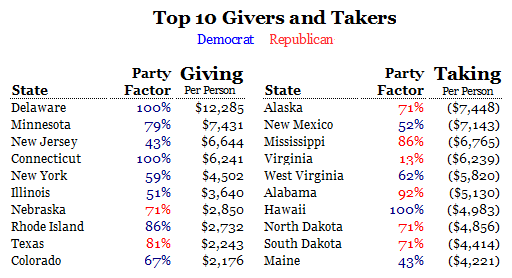
Being a curious sort of fellow, I decided to go look at raw data and see who was taking and who was giving. Below are documented the results of my quest.
Top 10's
The division between those states who take the most per person does not fall into party lines. Taker states seem to be largely rural, poor, or remote.
Total Contributions
When the total contributions by Republican and Democratic states is added together and average, there are some startling results.
The data shows that, in total, Democratic states give more in taxes than they receive in benefits.
States that are Republican controlled states take much more benefits all together than they pay in taxes.
Neutral states are those that have less than a 25% majority Democrat or Republican. These states are also net takers, but less so than Republican states.
Democratic states tend to be more populous than Republican states, thus the bars are not identical in size.
Nationally, Democrats gave each spent $1,114 more in taxes than they received in benefits and services. Republicans took $1,540 each on average. States with Neutral party affiliation took an extra $1,467 per person.
 |
| States that Lean Heavily Democratic |
Heavily Democratic states are a mixed bag of givers and takers.
I could find no clear trend in the most Democratic states were takers rather than givers when considered along party lines.
The data indicates there is a broader trend for states leaning Democratic to pay more even though the most Democratic states do not always give more.
 |
| States that Lean Heavily Republican |
Republican Takers
Heavily Republican states were much more likely to take more from the taxes than they gave in.
These states are often rural or poor. Of course not all rural and poor states are Republican.
These taker states tend to be in the south and west.
It is telling that there is a lack of major east and west coast states from the taker lists.
Givers and Takers
In the chart below, the states are ranked by how much they contribute or take from the general federal taxes by large green and red bars. The thin blue (Democratic) and thin red (Republican) bars indicated the strength of the part in each state. Clicking on the graphic will provide an expanded view.
Conclusions
Pundits have been saying that Democrats are a nation of 'takers' while Republicans are 'givers' whom Democrats take from. Even Presidential candidates have used this idea as campaign strategy.
The Givers and takers argument has become a center of our economic debate. It now seems common wisdom that some people give more and other people take more and that they can be divided upon party lines.
The facts, however, disagree. It turns out that on average Democrats give more taxes per person and Republicans take more benefits per person. Perhaps it is time to change the common wisdom?
Be sure to subscribe to Philomeme for more articles like these.
Methods and Sources
First came taxes and spending divided by how many people are in each state. This yielded an average giving or taking by person allowing apples-to-apples comparisons.
Next was counting the political parties of state and federally elected officials, including Governors. Averaging Democrats and Republicans Congressmen at a state and federal level gave a % Party Factor. A reasonable means to indicate if a state leaned heavily to one party or another.


No comments:
Post a Comment